What is cardiac drift and how does it affect heart rate training? Sports scientist, marathon runner and Ironman finisher Benjamin Garcia gives us the nitty-gritty.
Before we take a dive into the deep end, let’s get started by first defining the key terms related to cardiac drift.
What is Cardiac output?
The volume of blood pumped by the heart in one minute.
What is Stroke volume?
The volume of blood pumped from the left ventricle per beat.
What is Heart rate?
The number of heart beats per unit of time, usually per minute.
cardiac output Formula
Cardiac output is the product of stroke volume and heart rate. Cardiac output can be expressed by the below formula:
Cardiac output = stroke volume (SV) X heart rate (HR)
Why does this matter?
The human cardiovascular system is responsible for delivering a continuous supply of oxygen and nutrients to active muscles, which maintains a high level of energy transfer, while also removing metabolites.
Compared to static or dynamic resistance exercise, aerobic exercise demands an increase in energy and therefore an increase in oxygen (hence ‘aerobic exercise’). The bodies oxygen requirements are mainly dependent upon exercise intensity and duration.
Heart rate response to exercise
The body’s Autonomic Nervous System (ANS) is responsible for regulating physiological processes such as breathing and blood pressure. The ANS is split into two main parts, which are the
- Sympathetic Nervous System (SNS) and
- Parasympathetic Nervous System (PNS).
The PNS is mainly responsible for managing homeostasis and SNS is mainly responsible for causing action, such as the fight or flight response.
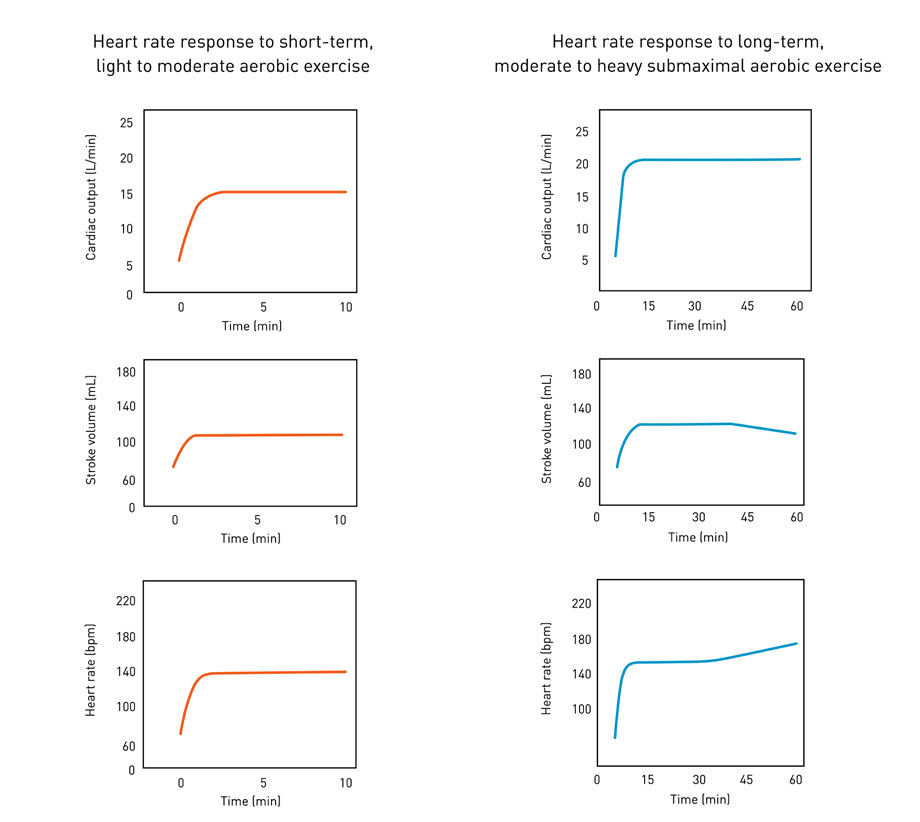
At the beginning of exercise there is a depression of the PNS and stimulation of the SNS, which causes a rapid increase in heart rate. This increase lasts for the first 1 to 2 minutes of exercise, with the degree of increase relating to exercise intensity. As shown in the below graphs heart rate then plateaus and is maintained at that level during lighter intensity exercise, whereas with higher intensity exercise heart rate plateaus after the initial increase and then gradually increases or drifts in an upwards direction.

The gradual upward drift of heart rate is matched by a comparative reduction in stroke volume, which enables cardiac output to be preserved.
Cardiac output and stroke volume response to exercise
At the start of light submaximal aerobic exercise lasting less than 10 minutes, cardiac output and stroke volume initially increase and both then plateau after only a couple of minutes and are maintained for the remainder of exercise. The rise in cardiac output is a result of a rise in heart rate and stroke volume and the subsequent plateau is a result of an appropriate supply of oxygen to sustain the metabolic demands of the physical activity.
The rise in cardiac output is a result of a rise in heart rate and stroke volume and the subsequent plateau is a result of an appropriate supply of oxygen to sustain the metabolic demands of the physical activity.
At the start of moderate-intensity aerobic exercise lasting over 30 minutes, cardiac output also increases, but to a higher level compared to lighter, submaximal exercise. The increase in cardiac output is due to an increase in both heart rate and stroke volume. As illustrated in the above graphs, stroke volume initially increases, then plateaus and then gradually declines. As moderate-intensity exercise continues passed the 30-minute mark stroke volume gradually decreases, although remains above resting levels.
What is cardiac drift?
Cardiac drift can be defined as the upward drift of heart rate over time, coupled with a progressive decline in stroke volume and the continued maintenance of cardiac output. Cardiac drift occurs while exercise intensity remains constant.
Cardiovascular physiologists suggest that cardiac drift is connected to an increase in core temperature and body water losses. When core body temperature increases a similar increase is seen in heart rate. Furthermore, when core body temperature increases the body responds by increasing skin blood flow to help control the temperature rise. The increase in skin blood flow occurs at the same time that the working muscles demand a large proportion of blood flow, which creates competition and demand from different parts of the body.
Cardiac drift can be defined as the upward drift of heart rate over time, coupled with a progressive decline in stroke volume and the continued maintenance of cardiac output.
To understand the importance of fluid losses on cardiac drift researchers looked at cyclists who cycled for 2 hours either with or without taking on extra fluids during exercise. The group of cyclists who didn’t consume any fluids during their cycle experienced an increase in heart rate of 10%. When the group of cyclists who were able to consume enough fluids to match sweat rate completed their cycle their heart rate increased by only 5%. The study concluded that half the cardiovascular drift experienced by the cyclists could be explained by dehydration.
How does cardiac drift affect my training?
So when you’re on the go for an extended period of time, there are, in this case, a few considerations.
Firstly, think about how to optimize hydration before, during and after exercise to ensure you’re properly hydrated. Secondly, if you’re measuring heart rate during exercise keep in mind the phenomenon of cardiac drift and that your heart rate may be up to 15% higher than you’re expecting for a given work rate. This has a knock-on effect if the aim of a specific training session is to be exercising in a specific heart rate zone or window.
Your Polar heart rate monitor can be an invaluable tool during training and competition. Happy training!
If you liked this post, don’t forget to share so that others can find it, too.
Or give it a thumbs up!
I like this article
Please note that the information provided in the Polar Blog articles cannot replace individual advice from health professionals. Please consult your physician before starting a new fitness program.

